A deep dive into the Irvine housing market presents a vivid picture of property values, demand patterns, and comparative market standings within the diverse array of Orange County real estate. This detailed examination critically examines the various property types within the Irvine housing market and their relative market positions, providing crucial insights for prospective buyers and investors navigating this vibrant and ever-changing landscape.
Table of Contents
Irvine Housing Market Data
1. Median Home Price
This section analyzes Irvine, California’s housing market by detailing home prices and breaking them down by property type. It outlines the general trend of higher pricing for single-family homes compared to townhouses and condos. Additionally, it compares Irvine’s home prices with those in other Orange County cities, allowing for a broader understanding of its market position. The data will equip prospective buyers with valuable insights for making informed purchasing decisions in Irvine.
- Current Sales Prices of Irvine Homes
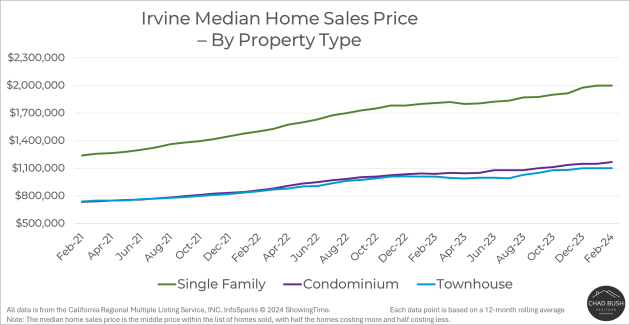
The data below showcases Irvine’s property values with an overall median sales price of $1,400,000. Among these, single-family homes command the highest median price of $2,000,000, suggesting a premium segment. Townhouses and condos are more moderate options, with a median price of $1,100,000 and $1,168,000, respectively. These price points reflect the diverse range of housing opportunities available to suit various financial capabilities within the Irvine housing economy.
| Property Type | Irvine Median Home Sales Price |
| All Properties | $1,400,000 |
| – Single-Family Home | $2,000,000 |
| – Townhouse | $1,100,000 |
| – Condominium | $1,168,000 |
All data is from the California Regional Multiple Listing Service, INC. InfoSparks © 2024 ShowingTime.
- Irvine Home Sales Prices Over Time
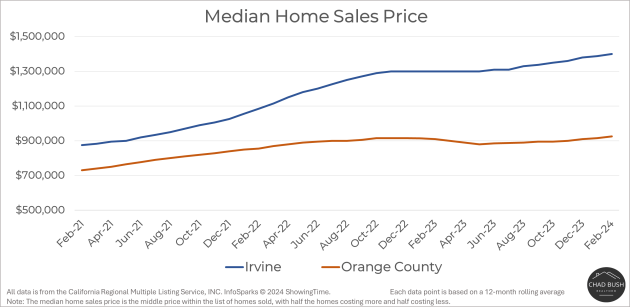
These charts illustrate a consistent escalation in Irvine’s median home sales prices, marking a substantial rise over time. As evidenced, single-family homes show the most pronounced increase, underscoring their escalating desirability in the market. In comparison, the growth trajectory for condominiums and townhouses is more modest, maintaining stability and suggesting a steady demand for these property types. Collectively, the trends reflect a dynamic Irvine housing market that, while exhibiting overall growth, does so with varying intensities across different housing categories.
- Current Home Sales Prices – Irvine vs. Other Orange County Cities
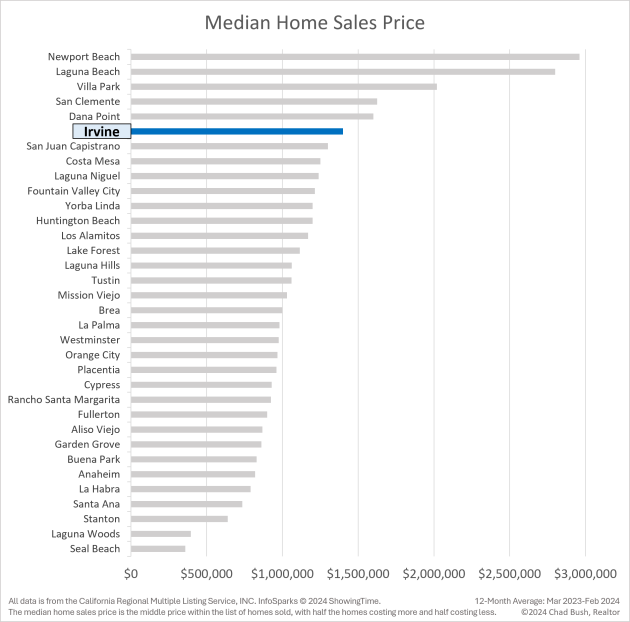
The graph identifies Irvine as a prominent player in the Orange County real estate market, with median home sales prices that are competitive and reflective of its desirability. While not reaching the peak prices of Newport Beach, Irvine holds its ground with substantial property values, indicating its strong market status among neighboring cities. The varied pricing across the county positions Irvine as a sought-after location, offering quality living and investment opportunities.
2. Supply and Demand – Irvine Housing Market
This section provides a comprehensive look at Irvine’s housing market’s supply and demand dynamics. It outlines the total housing stock, active listings, recent sales, current inventory level, and how quickly homes are selling. A snapshot of these indicators helps illustrate the market’s fluidity and efficiency, providing prospective buyers with a clearer understanding of the pace and health of Irvine’s real estate activities.
- Key Housing Market Indicators – Irvine
The Irvine housing market is currently characterized by a robust selection of available properties and a steady pace of sales. There are 251 active home listings within the city. Sales are consistent, with 171 homes sold recently, reflecting a vibrant real estate market. The inventory for Irvine stands at a 1.5-month supply, ensuring a quick turnaround in the housing market with an average of only 11 days from listing to sale. This data demonstrates an efficient market with properties moving rapidly from listing to closure.
| Total Homes in Irvine | ~119,200 |
| Active Home Listings | 251 |
| Homes Sold | 171 |
| Inventory – Months Supply | 1.5 |
| Days on Market | 11 |
Total Homes in Irvine: This refers to the approximate number of residential properties within the city.
Active Home Listings: The number of homes currently listed for sale in Irvine.
Homes Sold: A count of the actual sales that have closed in a given month. Calculations are based on sold data.
Inventory – Months Supply: The inventory of homes for sale at the end of a given month, divided by the average monthly Pending Sales from the last 12 months. Also known as absorption rate.
Days on Market: The average number of days between the listing of a home in Irvine and the acceptance of an offer in a given month.
- Irvine Active Listings vs. Homes Sold Over Time
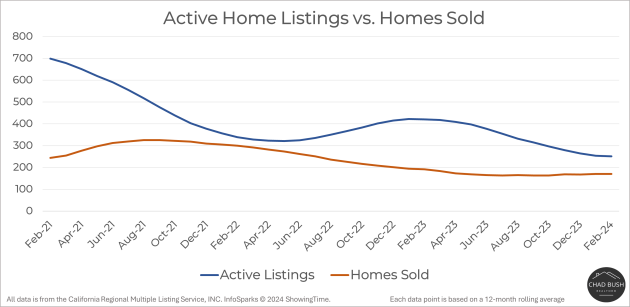
In Irvine, the trend of active home listings has declined since early 2021, while the number of homes sold has fluctuated with a noticeable peak. In recent times, both active listings and completed sales have reached a state of equilibrium, signifying a market that has found its pace, indicating a consistent demand for homes in contrast to the more variable trends of the past.
- Current Days on Market – Irvine vs. Other Orange County Cities
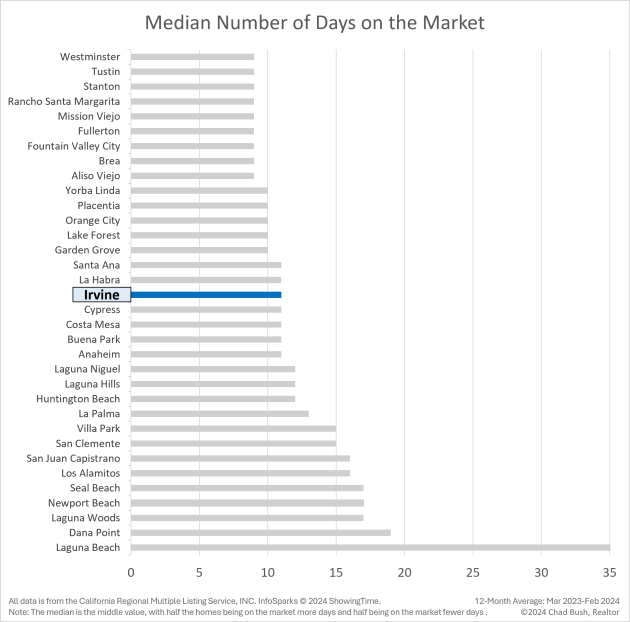
In Irvine, homes exhibit an average market duration that is competitive within Orange County, with a median number of days on the market that underscores a vibrant and active real estate market. This indicates that while properties in Irvine may not sell as rapidly as in some neighboring cities, they still move at a pace that reflects strong demand and a healthy, competitive housing landscape.
3. Property Taxes
Property taxes in California are determined by a combination of state law and county-specific regulations. Under Proposition 13, enacted in 1978, the base tax rate for properties is fixed at 1% of the assessed value. This assessed value is initially pegged to the purchase price and can only increase by a maximum of 2% annually, safeguarding homeowners from steep tax hikes when property values escalate quickly.
Orange County follows this state framework but also applies additional levies that can vary significantly between locations within the county. These can include voter-approved debt rates for city and district improvements and direct assessments for community services like flood control and street lighting. Also, properties in areas with Mello-Roos districts may incur additional taxes for community facilities.
To help understand this, consider the property tax bill example below. It breaks down the individual components that constitute the total tax obligation. Notably, while the General Tax Levy remains constant at 1%, the aggregate of additional charges, such as special district assessments, significantly affects the overall tax bill. These variations emphasize the importance of due diligence in comprehending the full scope of property taxes when assessing the cost of homeownership in different parts of Orange County.

4. Median Home Size
This section examines the median home size and price per square foot in Irvine, essential indicators for assessing property value and space. These metrics aid prospective buyers in comparing market value and understanding what their budget can secure in terms of home size, especially in relation to other areas in Orange County.
- Irvine Home Size and Value
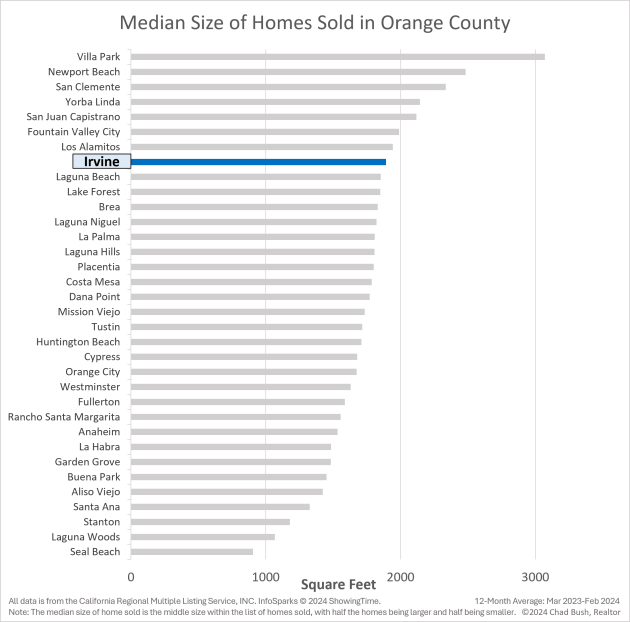
In Irvine, the housing market offers properties with an impressive median size of around 1,890 square feet, which is quite generous when compared across Orange County. However, this space comes at a premium, with the price per square footnoted at $740, indicating Irvine’s market reflects a higher valuation of property space, appealing to those seeking larger residences within the county’s diverse housing landscape.
| Median Home Size | ~1,890 ft2 |
| Price per Square Foot | $740 |
All data is from the California Regional Multiple Listing Service, INC. InfoSparks © 2024 ShowingTime.
Irvine Residents Data
1. Population
Exploring the dynamics of Irvine’s population and its density offers a glimpse into the city’s living conditions and community structure. Population density, which measures the number of residents per square mile, sheds light on how closely people live together and can indicate the balance between urban development and available living space. Understanding this helps explain how population concentration impacts the social fabric, infrastructure, and lifestyle of residents in Irvine in relation to other parts of Orange County.
- Irvine Population Statistics
Irvine has a population of around 318,396 and a moderate density of 4,852 residents per square mile, indicating a large but comfortably spaced coastal community.
| Population | 318,396 |
| Population Density (Residents per square mile) | 4,852 |
- Population Density – Irvine vs. Other Orange County Cities
Irvine, with its lighter shade on the map, indicates a lower population density compared to central Orange County cities like Santa Ana and Garden Grove. This suggests that Irvine offers a less crowded living environment, potentially providing more space and privacy for its residents within the bustling county.

2. Employment Industries and Median Income
Exploring Irvine’s economic landscape reveals the key employment sectors underpinning the local job market and the median household income, which reflect the community’s overall financial health. A deeper understanding of these factors helps frame Irvine’s economic position within the wider context of Orange County.
- Irvine Industries and Employment Breakdown
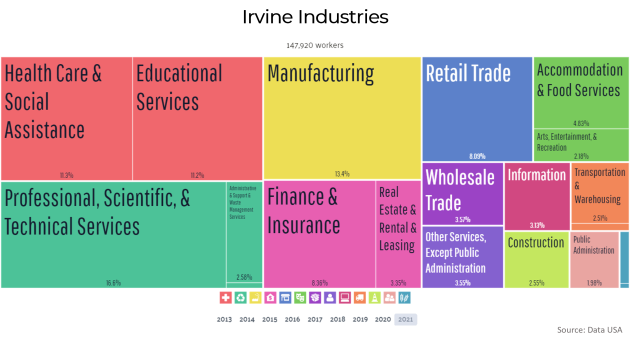
The most prominent employment sectors in the area are Professional, Scientific, & Technical Services, Manufacturing, Health Care and Social Assistance, and educational services. This suggests a fairly diverse labor force.
- Irvine Median Household Income and Employment Rate
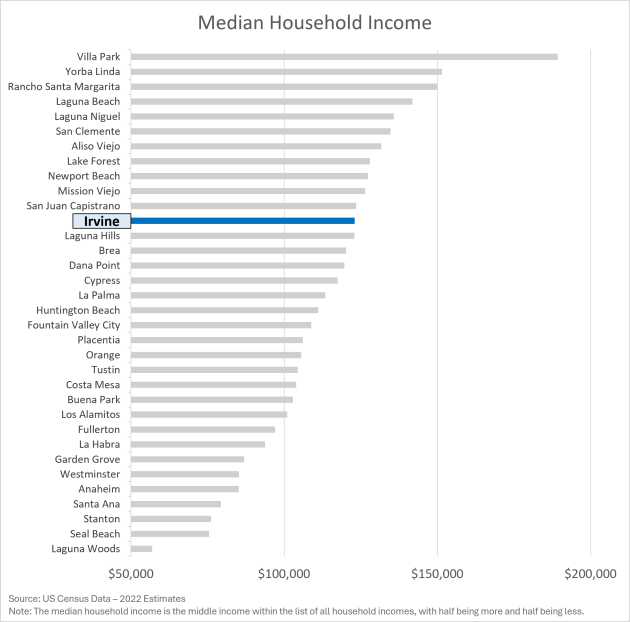
Irvine’s economic landscape is characterized by a relatively elevated median household income of $123,003, standing above many of its neighboring cities in Orange County, which signals the area’s prosperity. The employment rate in Irvine is a robust 64.20%, which may not be the absolute highest but still reflects a healthy job market. This combination suggests that while well-paying roles bolster income levels, the city’s affluence isn’t solely dependent on high employment rates, indicating a diversely prosperous community.
| Median Household Income | $123,003 |
| Employment Rate | 64.20% |
(ages 16 and over) that is employed, excluding those not seeking employment, such as retirees and students.
Source: US Census Bureau
3. Irvine City Attractions
Irvine, California, is a master-planned city known for its educational institutions, innovative businesses, and extensive recreational facilities. Here are some of the main attractions:
- Irvine Spectrum Center: A premier outdoor shopping and entertainment complex with a giant Ferris wheel, movie theaters, and a wide array of restaurants and shops.
- University of California, Irvine (UCI): A top-ranked university with a beautiful campus, renowned for its academic programs, research facilities, and cultural events.
- Orange County Great Park: Features a balloon ride offering panoramic views, sports facilities, a farmers market, and expansive gardens.
- Irvine Regional Park: The oldest regional park in Orange County, offering paddle boating, train rides, hiking trails, and the Orange County Zoo.
- Pretend City Children’s Museum: An interactive museum designed for children to learn through play, simulating a miniature city.
- San Joaquin Wildlife Sanctuary: A peaceful haven for birdwatching, photography, and nature walks, showcasing Southern California’s native wetlands.
- Tanaka Farms: A working farm offering tours, produce picking, and seasonal events, emphasizing the importance of local agriculture.
- Irvine Museum Collection at UCI: Dedicated to preserving and displaying California Impressionist art, reflecting the region’s history and natural beauty.
- William R. Mason Regional Park: A vast park with a scenic lake, picnic areas, and biking trails, ideal for family outings and outdoor activities.
- Bommer Canyon: Part of the Irvine Ranch Natural Landmarks, offering hiking, biking, and guided tours in a preserved natural setting.
Irvine’s blend of educational excellence, innovative spirit, and commitment to green spaces and community well-being makes it a unique and desirable place to live and visit.
Conclusion
The Irvine housing market is characterized by diversity in property types and a healthy balance of supply and demand. Median home sizes and prices per square foot are instrumental in understanding the market value within Irvine relative to Orange County. An overview of the city’s population dynamics and key economic sectors further provides context to the real estate landscape, marking Irvine as a city with a substantial yet accessible housing market for a wide range of buyers.
Reach out if you have any questions or need assistance on your home-buying journey

