Located in the heart of Orange County, California, the Newport Beach housing market presents a unique opportunity for homebuyers. This article offers an in-depth analysis of the latest trends and key data points in the Newport Beach real estate landscape, essential for those considering a purchase in this area. With a focus on median home prices, the supply and demand dynamics, and comparative insights into the market’s position within the broader Orange County context, the aim is to provide prospective buyers with the critical information needed to navigate this market. From detailing current home costs by property type to exploring the nuances of property taxes and median home sizes, the content is designed to offer a comprehensive understanding of what to expect when buying a home in Newport Beach.
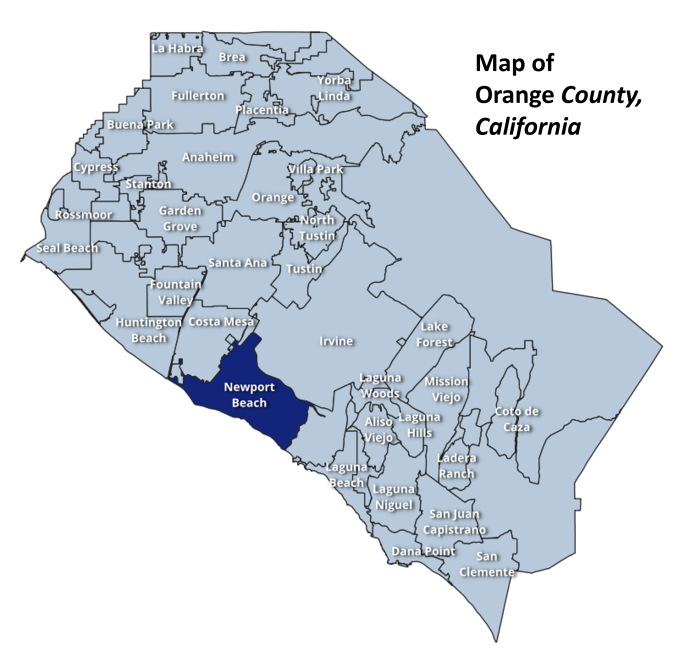
Table of Contents
Newport Beach Housing Market Data
1. Median Home Price
This section analyzes Newport Beach, California’s housing market by detailing current home prices and breaking them down by property type. It outlines the general trend of higher pricing for single-family homes compared to townhouses and condos. Additionally, it includes a comparison of Newport Beach’s home prices with those in other Orange County cities, allowing for a broader understanding of its market position. The data will equip prospective buyers with valuable insights for making informed purchasing decisions in Newport Beach.
- Current Sales Prices of Newport Beach Homes
The table below presents the typical sales prices for homes in Newport Beach, showing a median price of $2,960,000 overall. While single-family homes are at the premium end with a median cost of $3,875,000, townhouses and condos are more moderately priced at $1,438,000 and $1,258,000 respectively, offering options that can accommodate a variety of buyer budgets in the real estate market.
| Property Type | Newport Beach Median Home Sales Price |
| All Properties | $2,960,000 |
| – Single-Family Home | $3,875,000 |
| – Townhouse | $1,438,000 |
| – Condominium | $1,258,000 |
All data is from the California Regional Multiple Listing Service, INC. InfoSparks © 2024 ShowingTime.
- Newport Beach Home Sales Prices Over Time
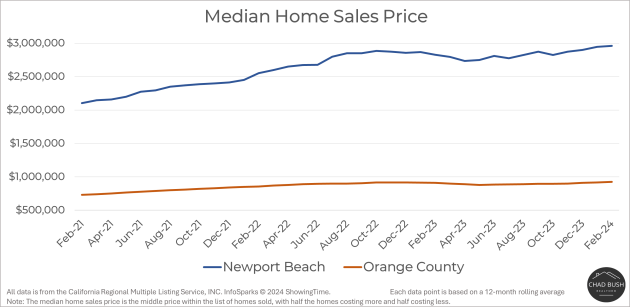
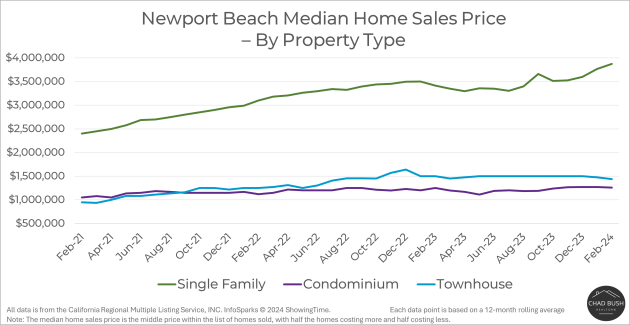
The charts below depict a steady rise in Newport Beach’s median home sales prices over time, consistently outpacing the broader Orange County market. Different property types show varying trends, with single-family homes experiencing significant growth, while condominiums and townhouses remain relatively stable, indicating a robust demand for detached homes in the area.
- Current Home Sales Prices – Newport Beach vs. Other Orange County Cities
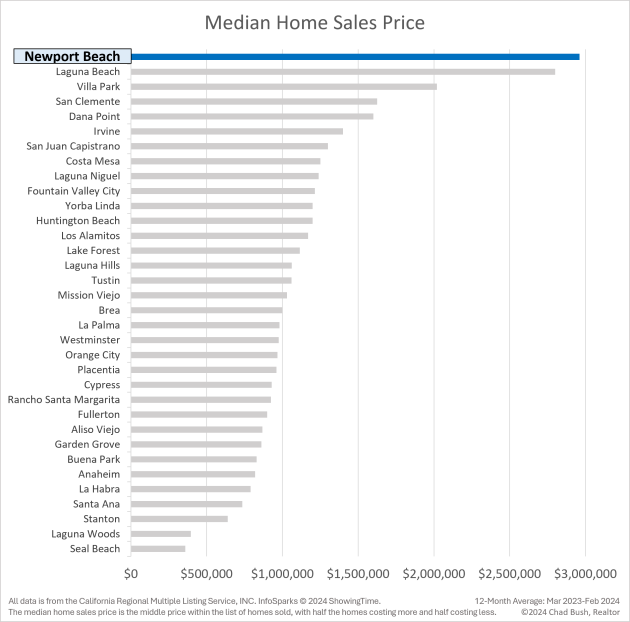
Newport Beach has the highest median home sales prices among Orange County cities, indicating its position as the area’s most premium real estate market.
2. Supply and Demand – Newport Beach Housing Market
This section provides a comprehensive look at the supply and demand dynamics within Newport Beach’s housing market. It outlines the total housing stock, active listings, recent sales, and the current inventory level, in addition to how quickly homes are selling. A snapshot of these indicators helps illustrate the market’s fluidity and efficiency, providing prospective buyers with a clearer understanding of the pace and health of Newport Beach’s real estate activities.
- Key Housing Market Indicators – Newport Beach
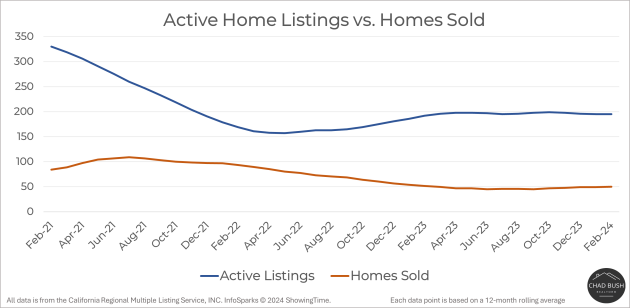
With a current monthly average of 195 homes up for grabs and 50 monthly transactions closing recently, Newport Beach’s real estate scene is active. It offers a balanced 4.1-month inventory and a swift average sale time of just 17 days.
| Total Homes in Newport Beach | ~45,000 |
| Active Home Listings | 195 |
| Homes Sold | 50 |
| Inventory – Months Supply | 4.1 |
| Days on Market | 17 |
Total Homes in Newport Beach: This refers to the approximate number of residential properties within the city.
Active Home Listings: The number of homes currently listed for sale in Newport Beach.
Homes Sold: A count of the actual sales that have closed in a given month. Calculations are based on sold data.
Inventory – Months Supply: The inventory of homes for sale at the end of a given month, divided by the average monthly Pending Sales from the last 12 months. Also known as absorption rate.
Days on Market: The average number of days homes in Newport Beach stay listed and when an offer is accepted in a given month.
- Newport Beach Active Listings vs. Homes Sold Over Time
Newport Beach saw a marked decrease in active home listings compared to early 2021. However, the number of active listings and homes sold have both leveled off over the past year, indicating a steadying though less active market compared to the peaks seen previously.
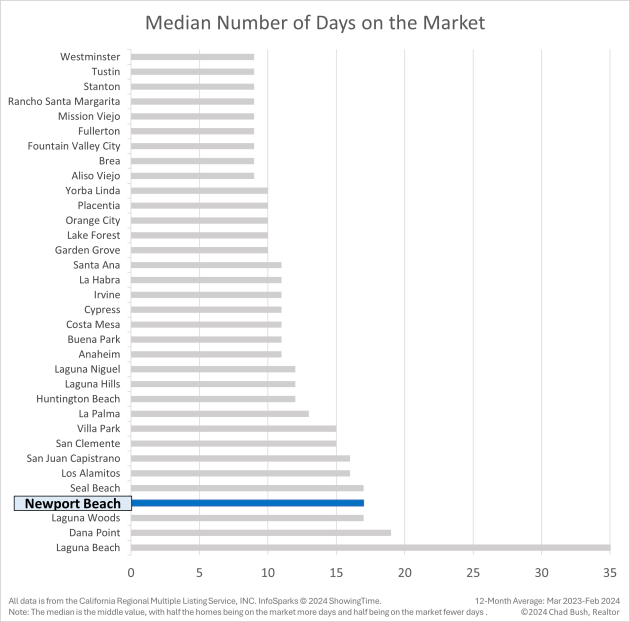
- Current Days on Market – Newport Beach vs. Other Orange County Cities
Homes in Newport Beach tend to remain on the market longer than in many other Orange County cities, yet they still sell relatively swiftly, showcasing the city’s robust real estate demand within a competitive national context.
3. Property Taxes
Property taxes in California are determined by a combination of state law and county-specific regulations. Under Proposition 13, enacted in 1978, the base tax rate for properties is fixed at 1% of the assessed value. This assessed value is initially pegged to the purchase price and can only increase by a maximum of 2% annually, safeguarding homeowners from steep tax hikes when property values escalate quickly.
Orange County follows this state framework but also applies additional levies that can vary significantly between locations within the county. These can include voter-approved debt rates for city and district improvements, and direct assessments for community services like flood control and street lighting. Also, properties in areas with Mello-Roos districts may incur additional taxes for community facilities.
To aid in understanding, consider the example of a property tax bill below. It breaks down the individual components that constitute the total tax obligation. Notably, while the General Tax Levy remains constant at 1%, the aggregate of additional charges, such as special district assessments, significantly affects the overall tax bill. These variations emphasize the importance of due diligence in comprehending the full scope of property taxes when assessing the cost of homeownership in different parts of Orange County.

4. Median Home Size
This section examines the median home size and price per square foot in Newport Beach, essential indicators for assessing property value and space. These metrics aid prospective buyers in comparing market value and understanding what their budget can secure in terms of home size, especially in relation to other areas in Orange County.
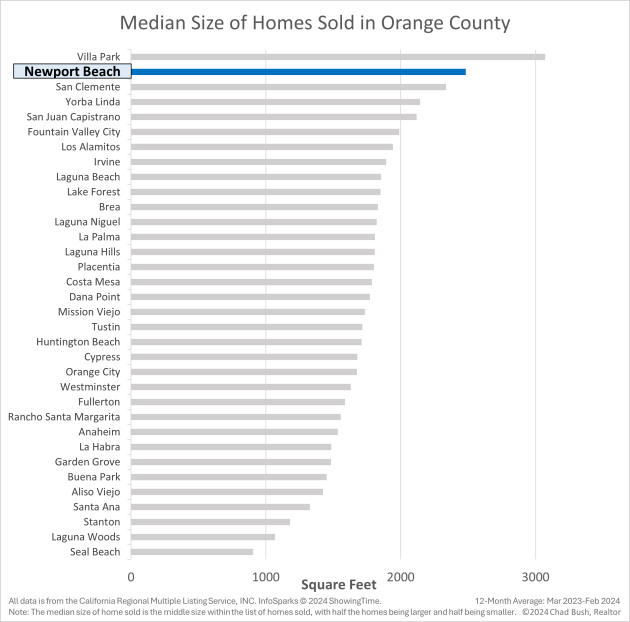
- Newport Beach Home Size and Value
Newport Beach homes boast a larger median size compared to other cities in Orange County, with sold properties typically around 2,500 square feet. Additionally, Newport Beach commands a higher price per square foot, at $1,192, indicating a premium market with both spacious homes and a higher value placed on property space.
| Median Home Size | ~2,500 ft2 |
| Price per Square Foot | $1,192 |
All data is from the California Regional Multiple Listing Service, INC. InfoSparks © 2024 ShowingTime.
Newport Beach Residents Data
1. Population
Exploring the dynamics of Newport Beach’s population and its density offers a glimpse into the city’s living conditions and community structure. Population density, which measures the number of residents per square mile, sheds light on how closely people live together and can indicate the balance between urban development and available living space. Understanding this helps explain how population concentration impacts the social fabric, infrastructure, and lifestyle of residents in Newport Beach in relation to other parts of Orange County.
- Newport Beach Population Statistics
Newport Beach has a population of around 82,553 and a moderate density of 3,466 residents per square mile, indicating a comfortably populated coastal community.
| Population | 82,553 |
| Population Density (Residents per square mile) | 3,466 |
- Population Density – Newport Beach vs. Other Orange County Cities
Newport Beach, with its lighter shade on the map, indicates a lower population density compared to central Orange County cities like Santa Ana and Garden Grove. This suggests that Newport Beach offers a less crowded living environment, potentially providing more space and privacy for its residents within the bustling county.

2. Employment Industries and Median Income
Exploring the economic landscape of Newport Beach reveals the key employment sectors underpinning the local job market and the median household income, reflecting the community’s overall financial health. A deeper understanding of these factors helps frame Newport Beach’s economic position within the wider context of Orange County.
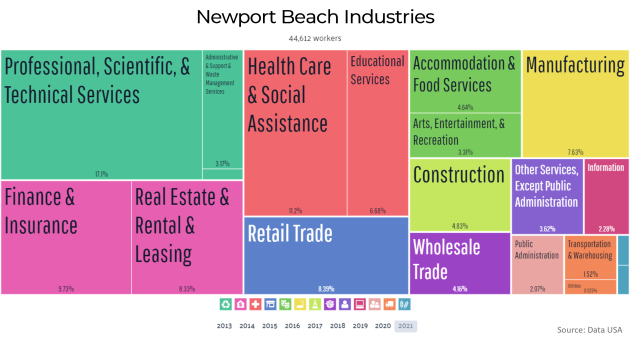
- Newport Beach Industries and Employment Breakdown
The most prominent employment sectors in the area are Professional, Scientific, & Technical Services, Health Care & Social Assistance, and Retail Trade, suggesting a labor force that is heavily involved in specialized professional services, health-related fields, and consumer sales.
- Newport Beach Median Household Income and Employment Rate
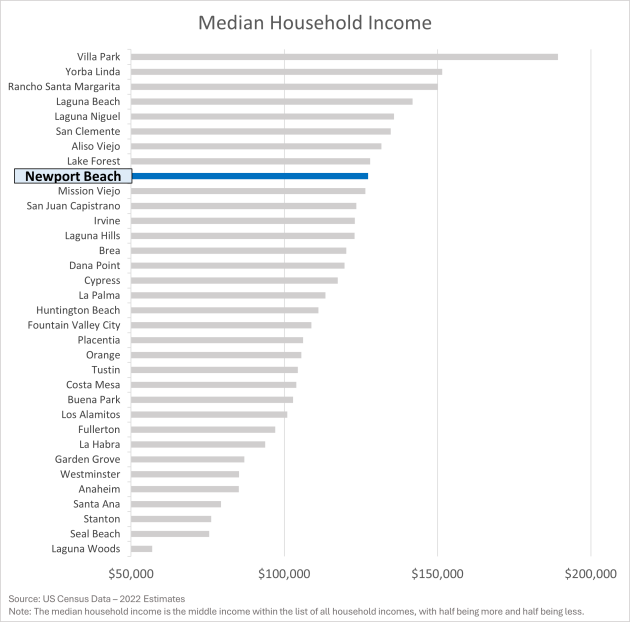
Newport Beach has a relatively high median household income, noticeably surpassing many other Orange County cities, reflecting the area’s economic affluence. However, the employment rate is not the highest, suggesting that the high income could be influenced by a concentration of high-paying jobs or higher wealth within the population rather than employment levels alone.
| Median Household Income | $127,353 |
| Employment Rate | 55.80% |
(ages 16 and over) that is employed, excluding those not seeking employment, such as retirees and students.
Source: US Census Bureau
3. Newport Beach City Attractions
Newport Beach, California, is known for its stunning coastal scenery, upscale lifestyle, and a variety of attractions that draw visitors and locals alike. Here are some of the main attractions:
- Balboa Peninsula: Offering a classic beach town experience with a boardwalk, Balboa Pier, and the Fun Zone with a Ferris wheel and arcade games.
- Fashion Island: An open-air shopping center with luxury retailers, fine dining, and entertainment options.
- The Wedge: Famous for its large waves, it’s a hotspot for bodyboarding, bodysurfing, and spectating.
- Corona del Mar State Beach: Known for its cliffside views and tide pools, it’s perfect for families and outdoor enthusiasts.
- Newport Harbor: Features boat tours, yacht charters, and is a departure point for the iconic Catalina Island.
- Crystal Cove State Park: Offers miles of hiking trails, sandy beaches, and a historic district with beach cottages.
- Newport Coast: Home to luxury resorts and golf courses with breathtaking ocean views.
- Marine Avenue on Balboa Island: Lined with boutiques, art galleries, and eateries, it’s ideal for a leisurely stroll.
- Orange County Museum of Art: Showcases modern and contemporary art exhibitions.
- Pelican Hill Golf Club: A world-class golf experience with panoramic ocean views.
- Newport Beach Film Festival: An annual event celebrating the best of classic and contemporary filmmaking.
These attractions contribute to the charm and allure of Newport Beach, making it a premier destination in Southern California.
Conclusion
The Newport Beach housing market, characterized by its high median home prices and premium real estate offerings, requires careful consideration by prospective buyers. This article has dissected crucial aspects of the market, providing a detailed look at pricing trends, supply and demand dynamics, and the overall health of the real estate scene in Newport Beach. By comparing these factors to other cities in Orange County, the analysis highlights Newport Beach’s position as a premium market. Additionally, insights into the median home size and local population and employment statistics offer a broader understanding of the living conditions and economic landscape. For those considering a home purchase in Newport Beach, this analysis serves as a foundational guide to making informed decisions in a competitive environment.
Reach out if you have any questions or need assistance on your home-buying journey

